The conflicts we follow
What each one is, how it got here and what it moves in markets, with a dated timeline and the figures that matter. Every analysis and note is filed under at least one.
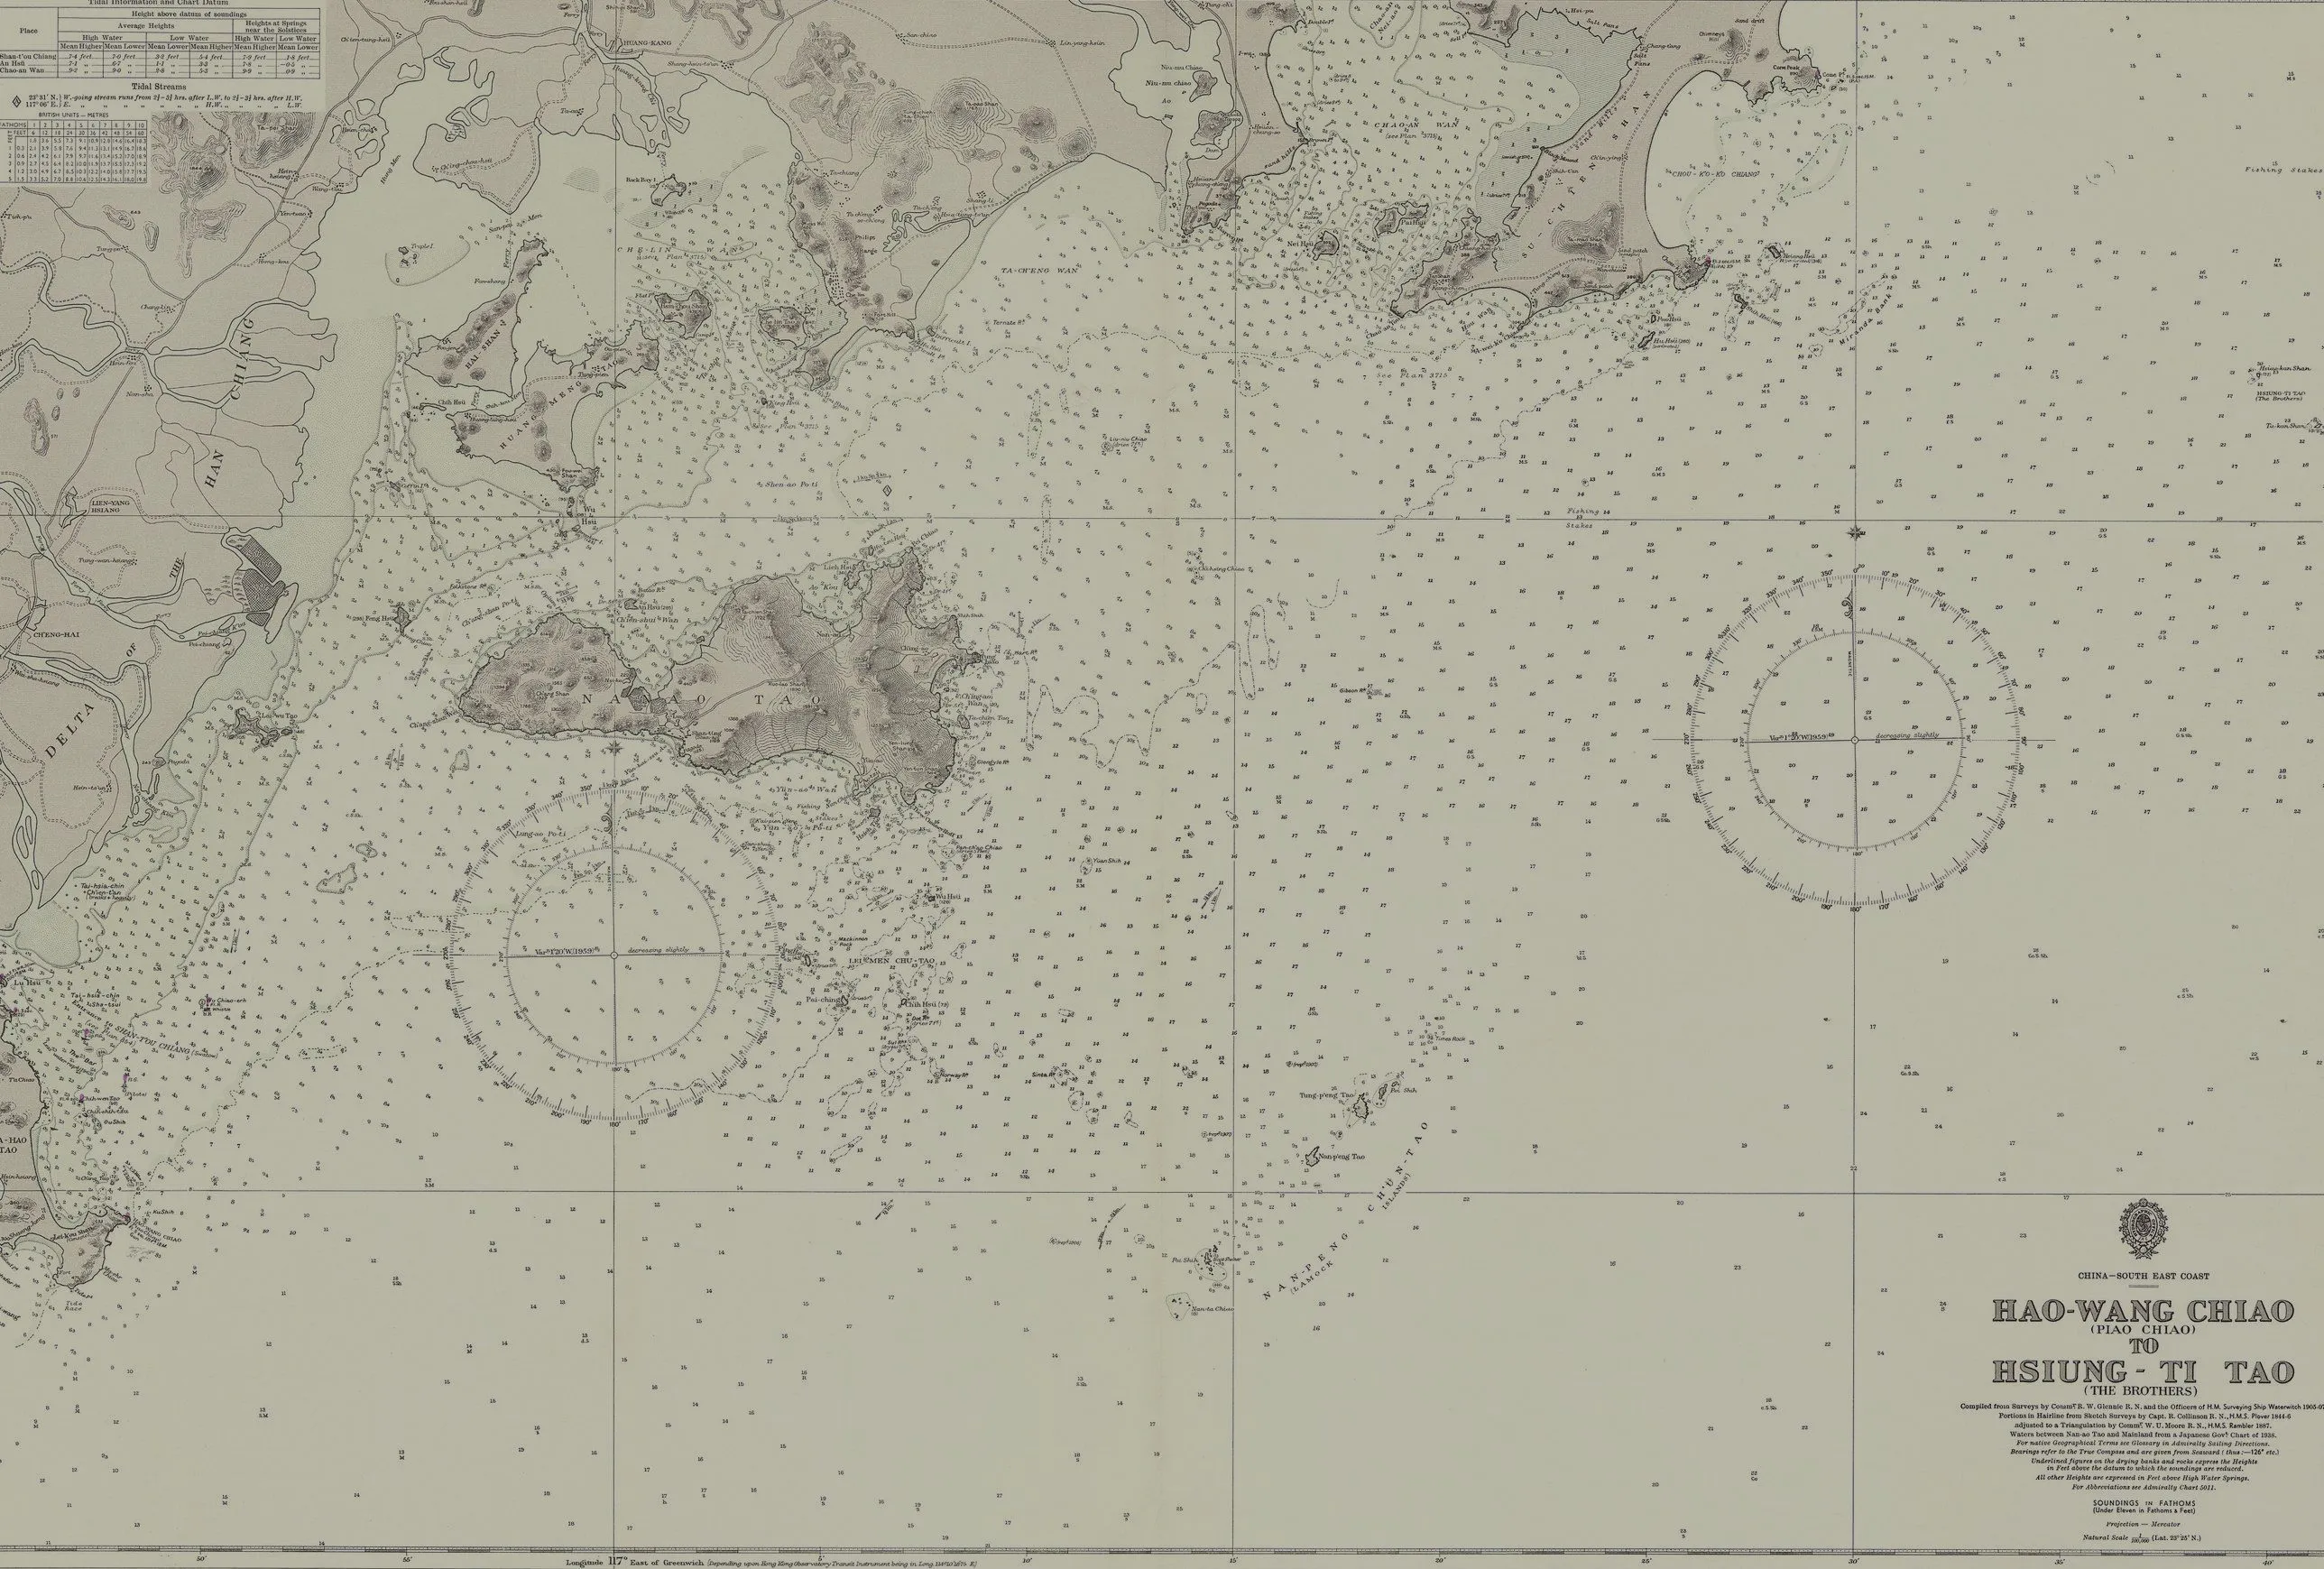
Admiralty Chart No. 1957, Hao-Wang Chiao to Hsiung-Ti Tao, on the Chinese side of the Taiwan Strait. Published 1934, new edition 1954. United Kingdom Hydrographic Office, Public domain.

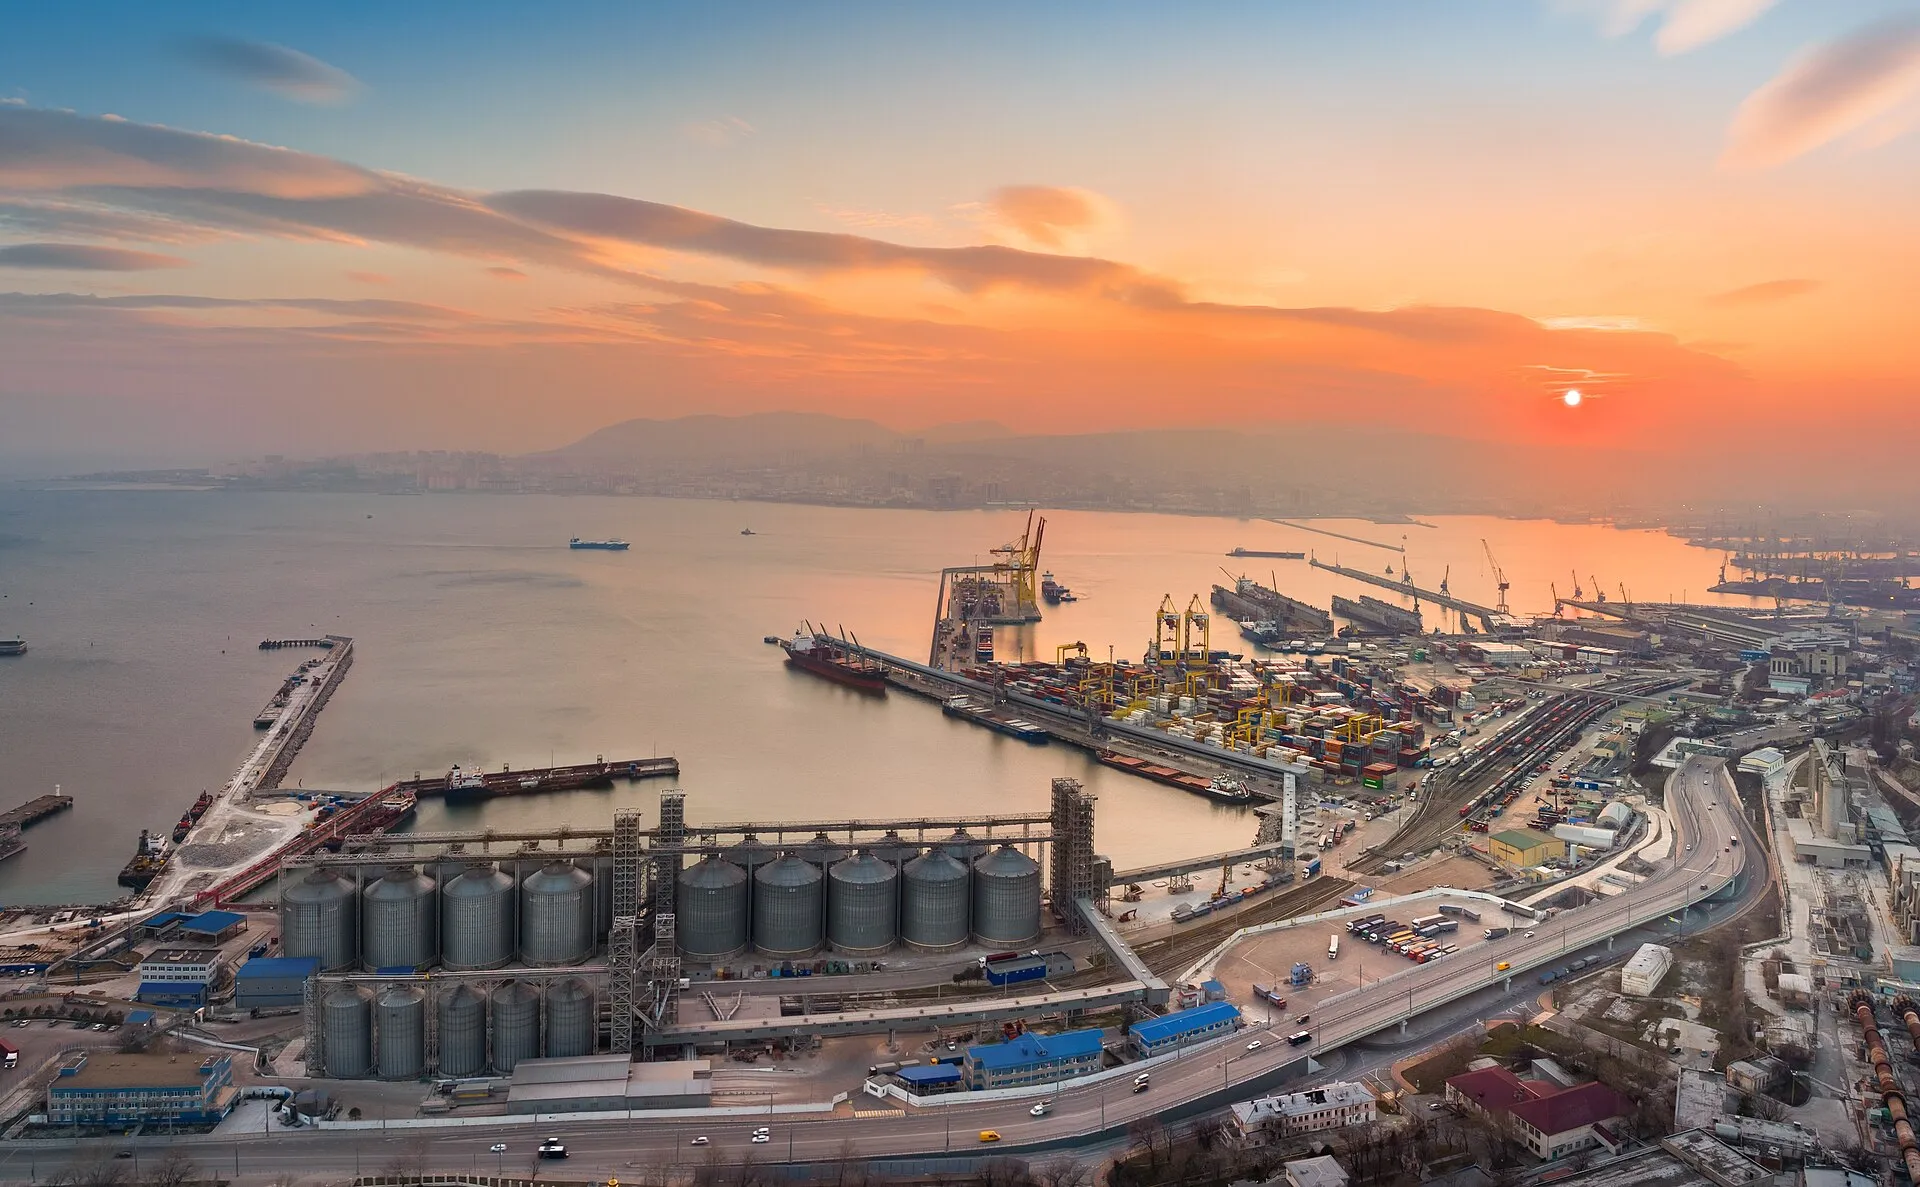
Open war · since 24 February 2022
Russia–Ukraine war
The war decides how much oil, diesel and gas Russia can sell and at what price under Western caps, and what it costs to move cargo across the Black Sea.
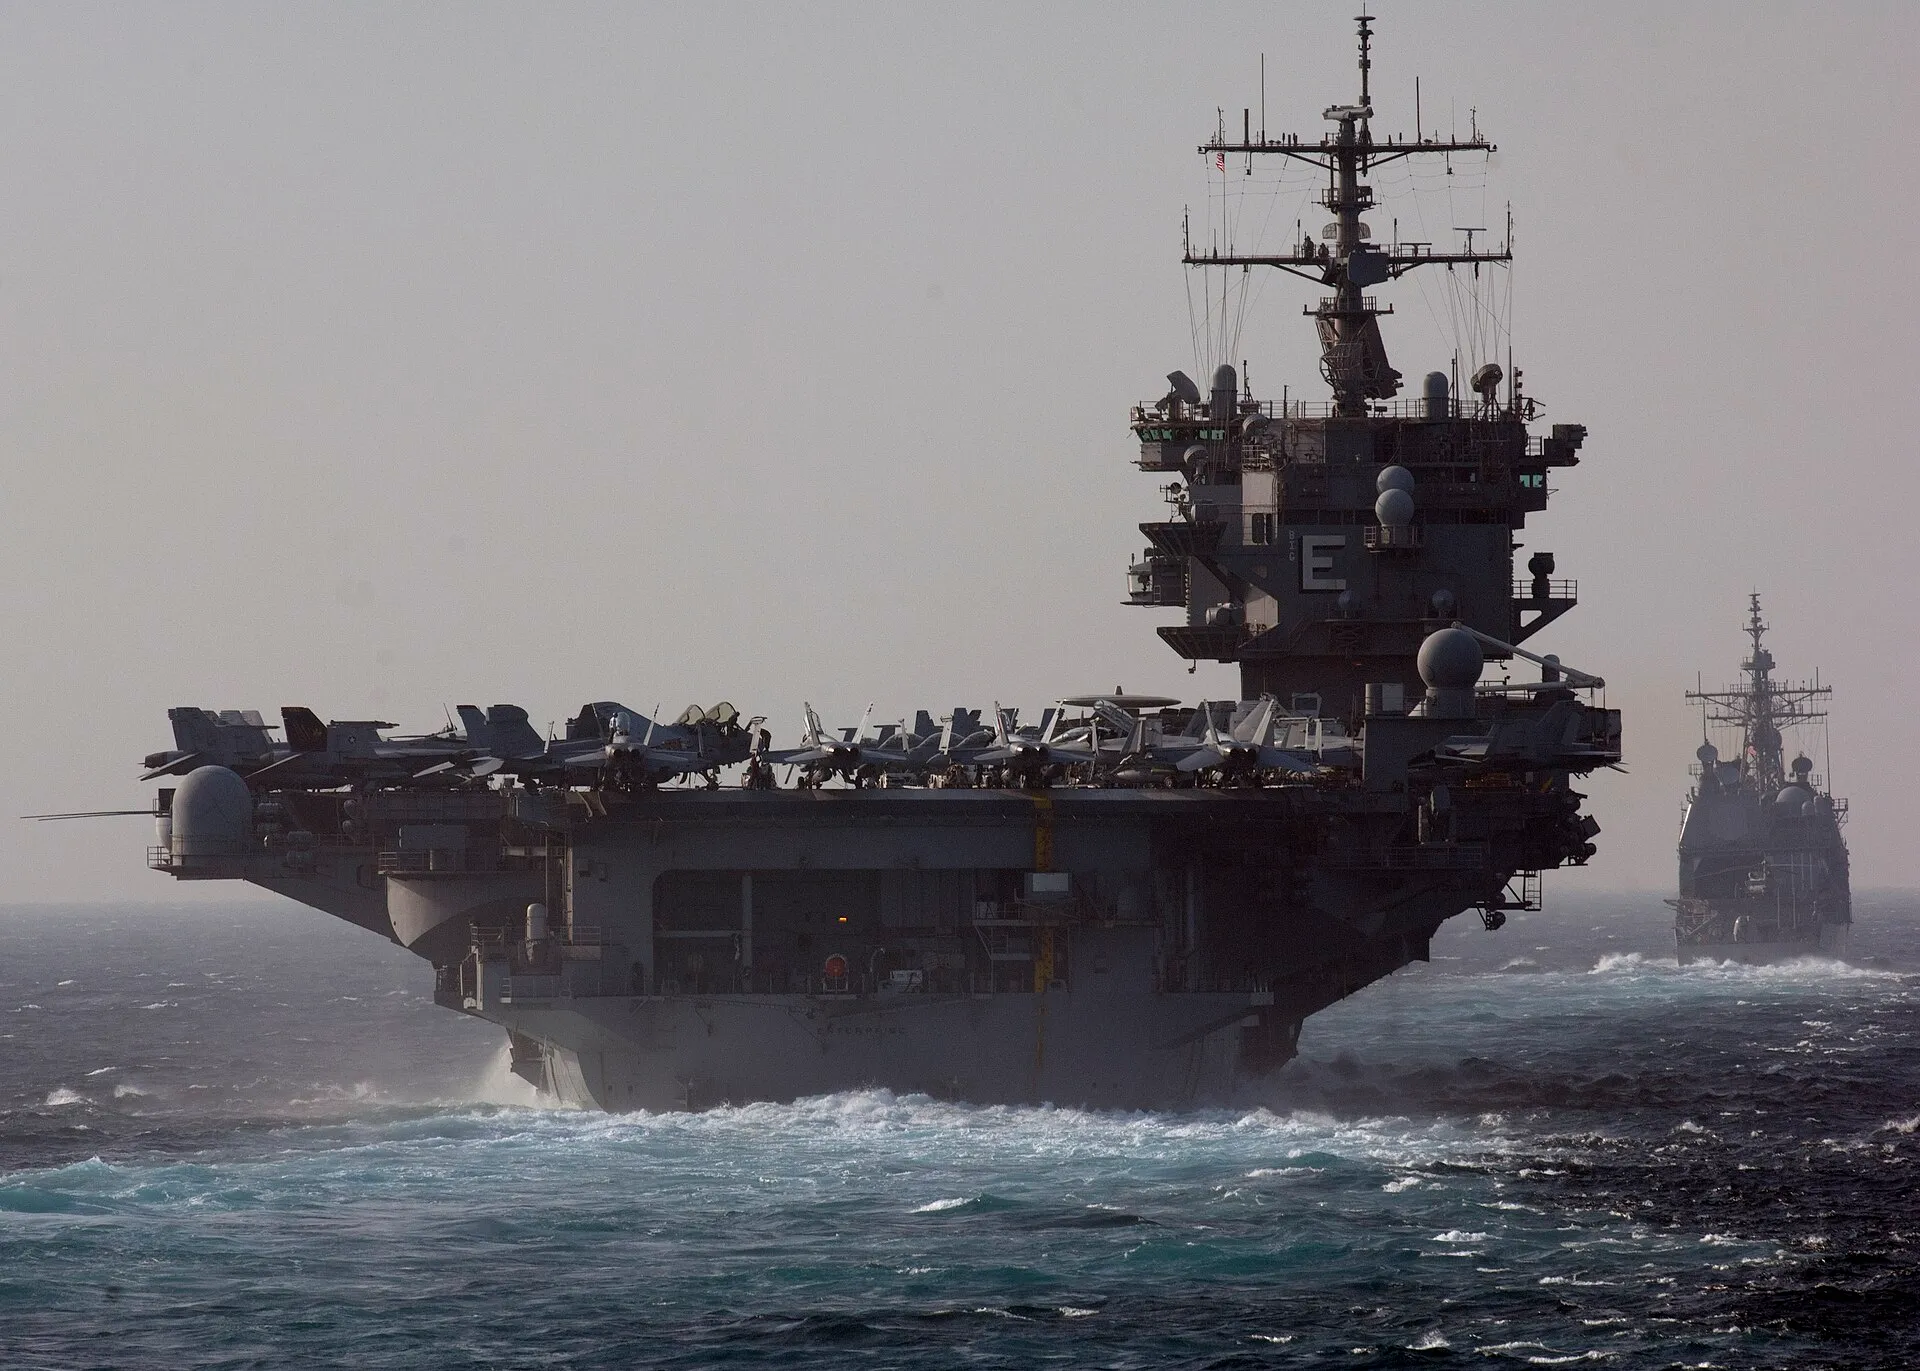
Open war · since 20 July 2026
Red Sea and the Saudi–Houthi war
Saudi Arabia and the Houthis are fighting along Bab el-Mandeb, the strait container lines are coming back to and Saudi energy has relied on more since the Iran war began.
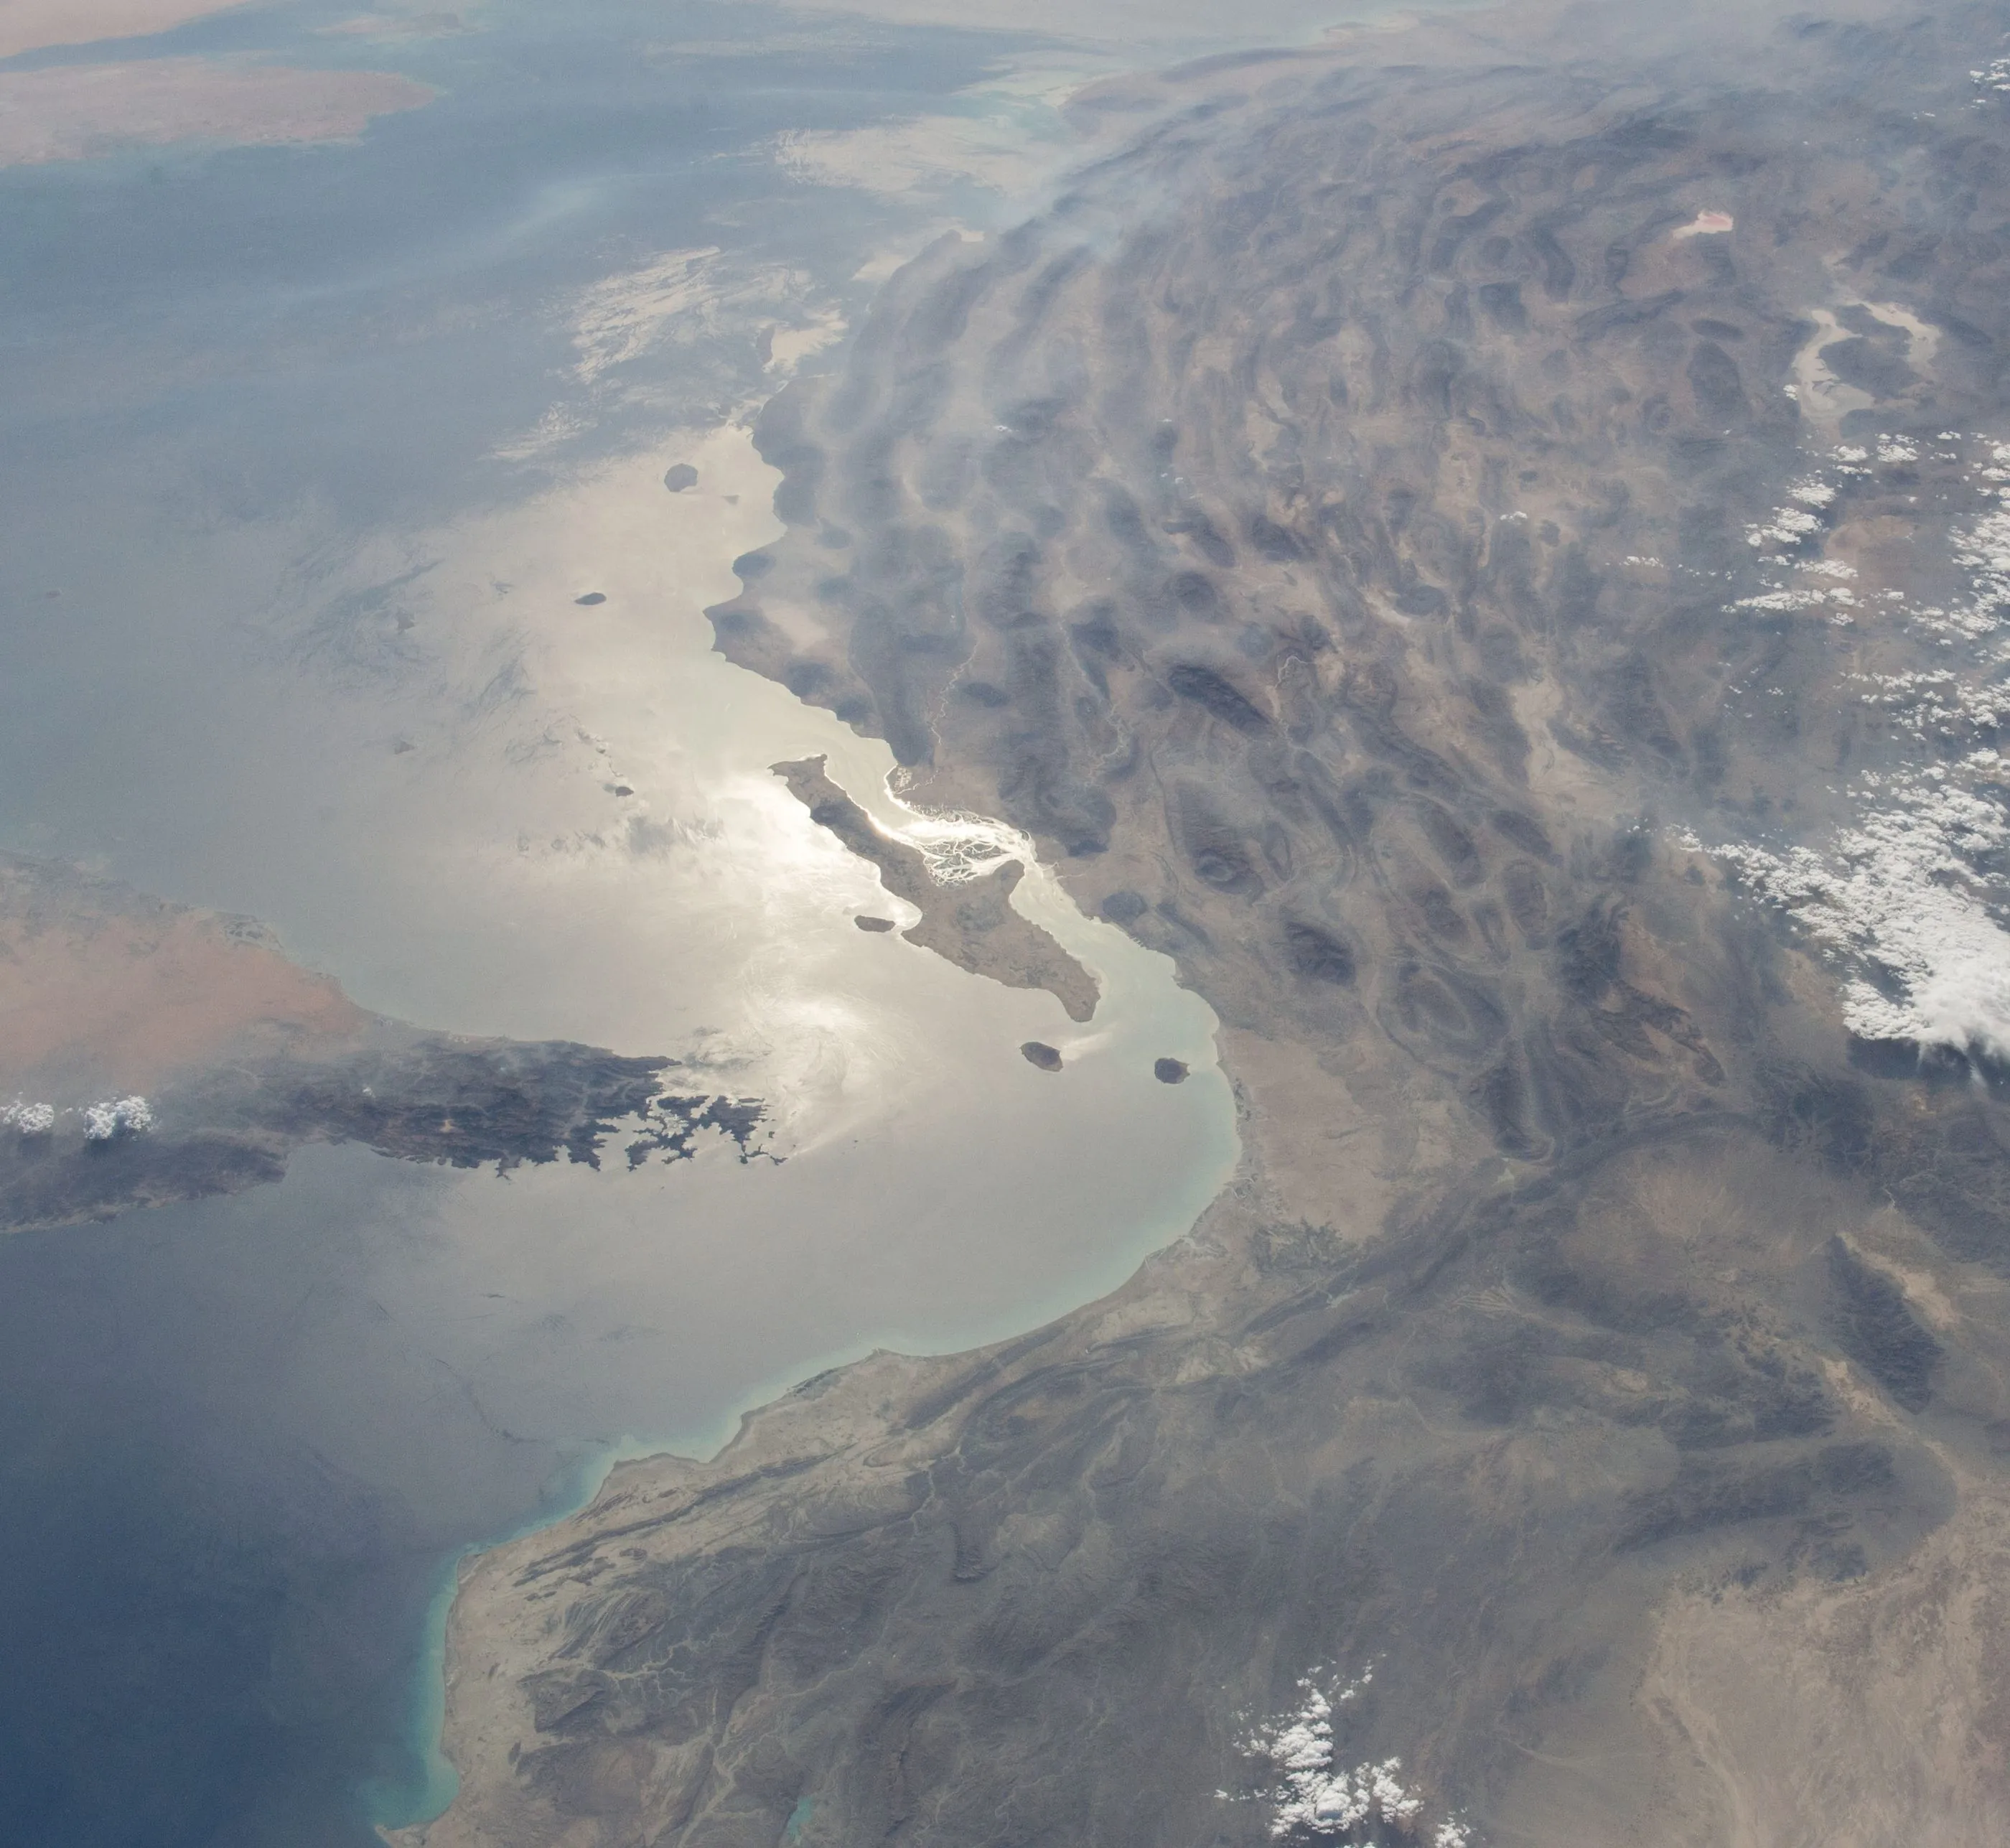
Open war · since 28 February 2026
Iran war and the Strait of Hormuz
The war decides how much of the Gulf's oil, fuel and gas can leave through the Strait of Hormuz, and what buyers pay to move it.
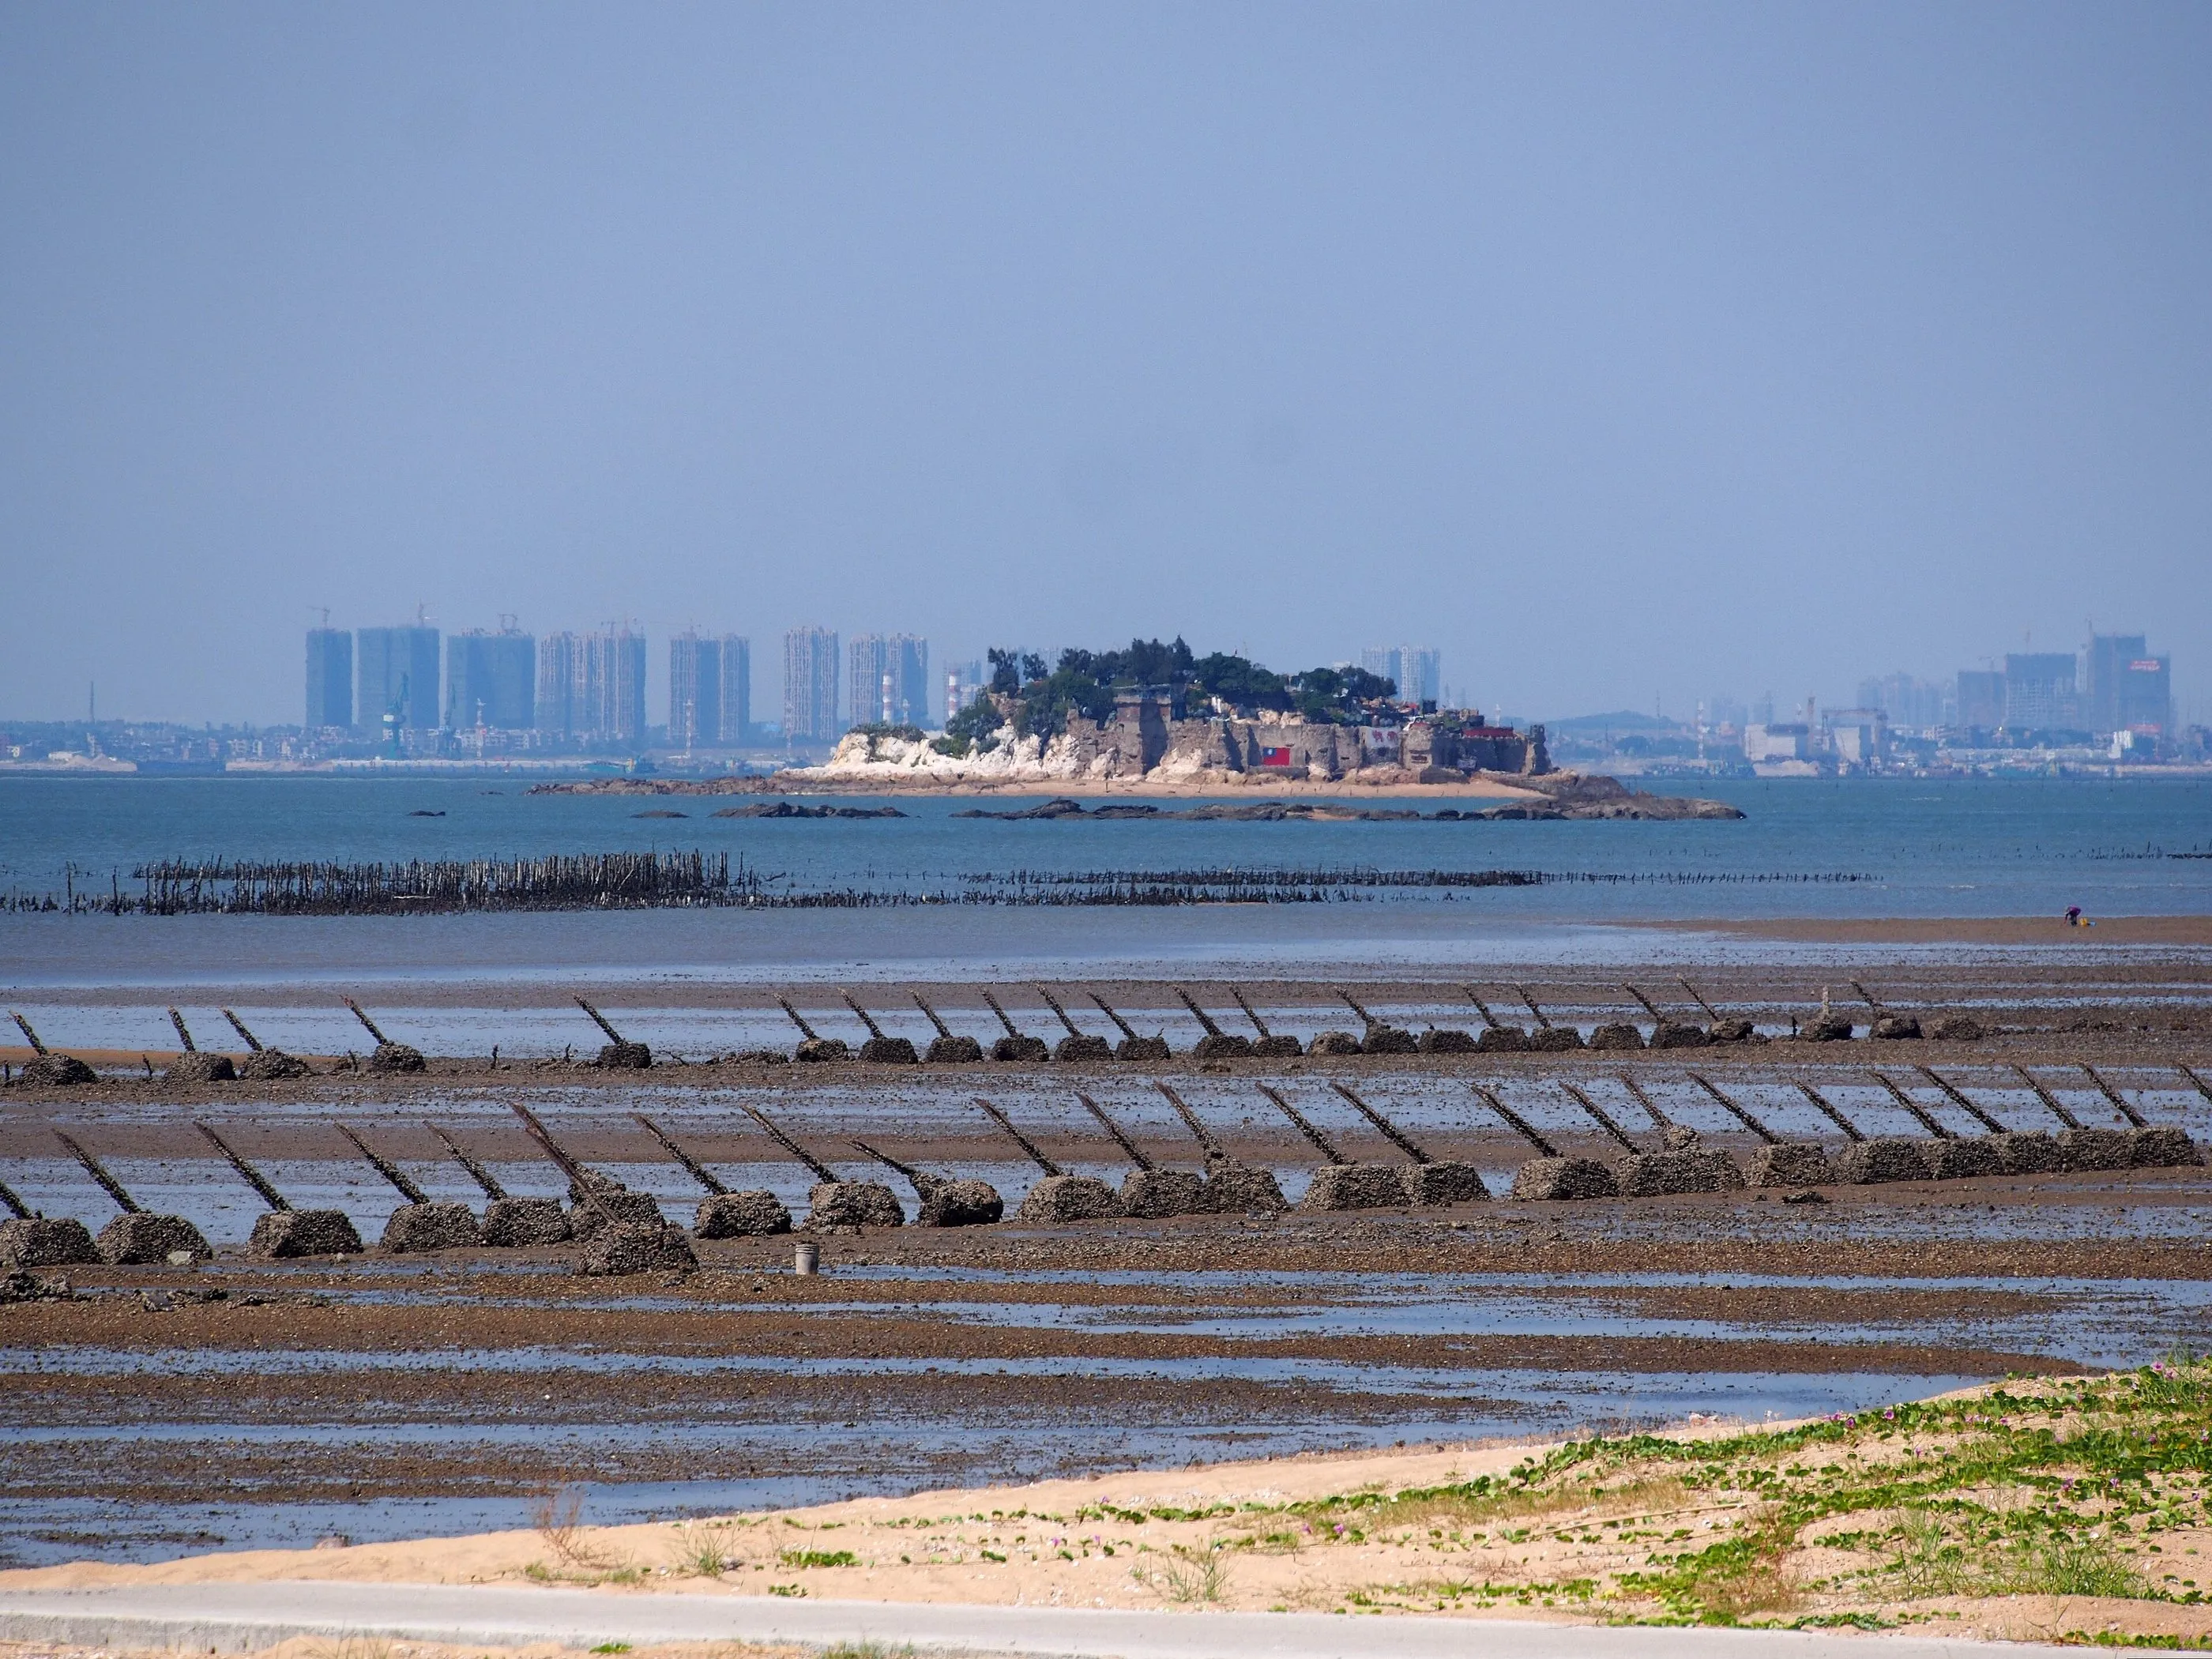
Standoff · since 20 May 2024
Taiwan Strait standoff
Taiwan makes most of the world's advanced chips, and the standoff decides whether markets can keep treating that supply, and the sea lanes around the island, as safe.