Note, 2 min read
US crude stocks fell to their lowest since 1983. Its exports fell by a million barrels a day.
Total US crude inventories dropped to 695.2 million barrels, their lowest in 43 years. Commercial stocks drew 3.1 million barrels, the SPR fell again, and exports dropped 1.13 million barrels a day.
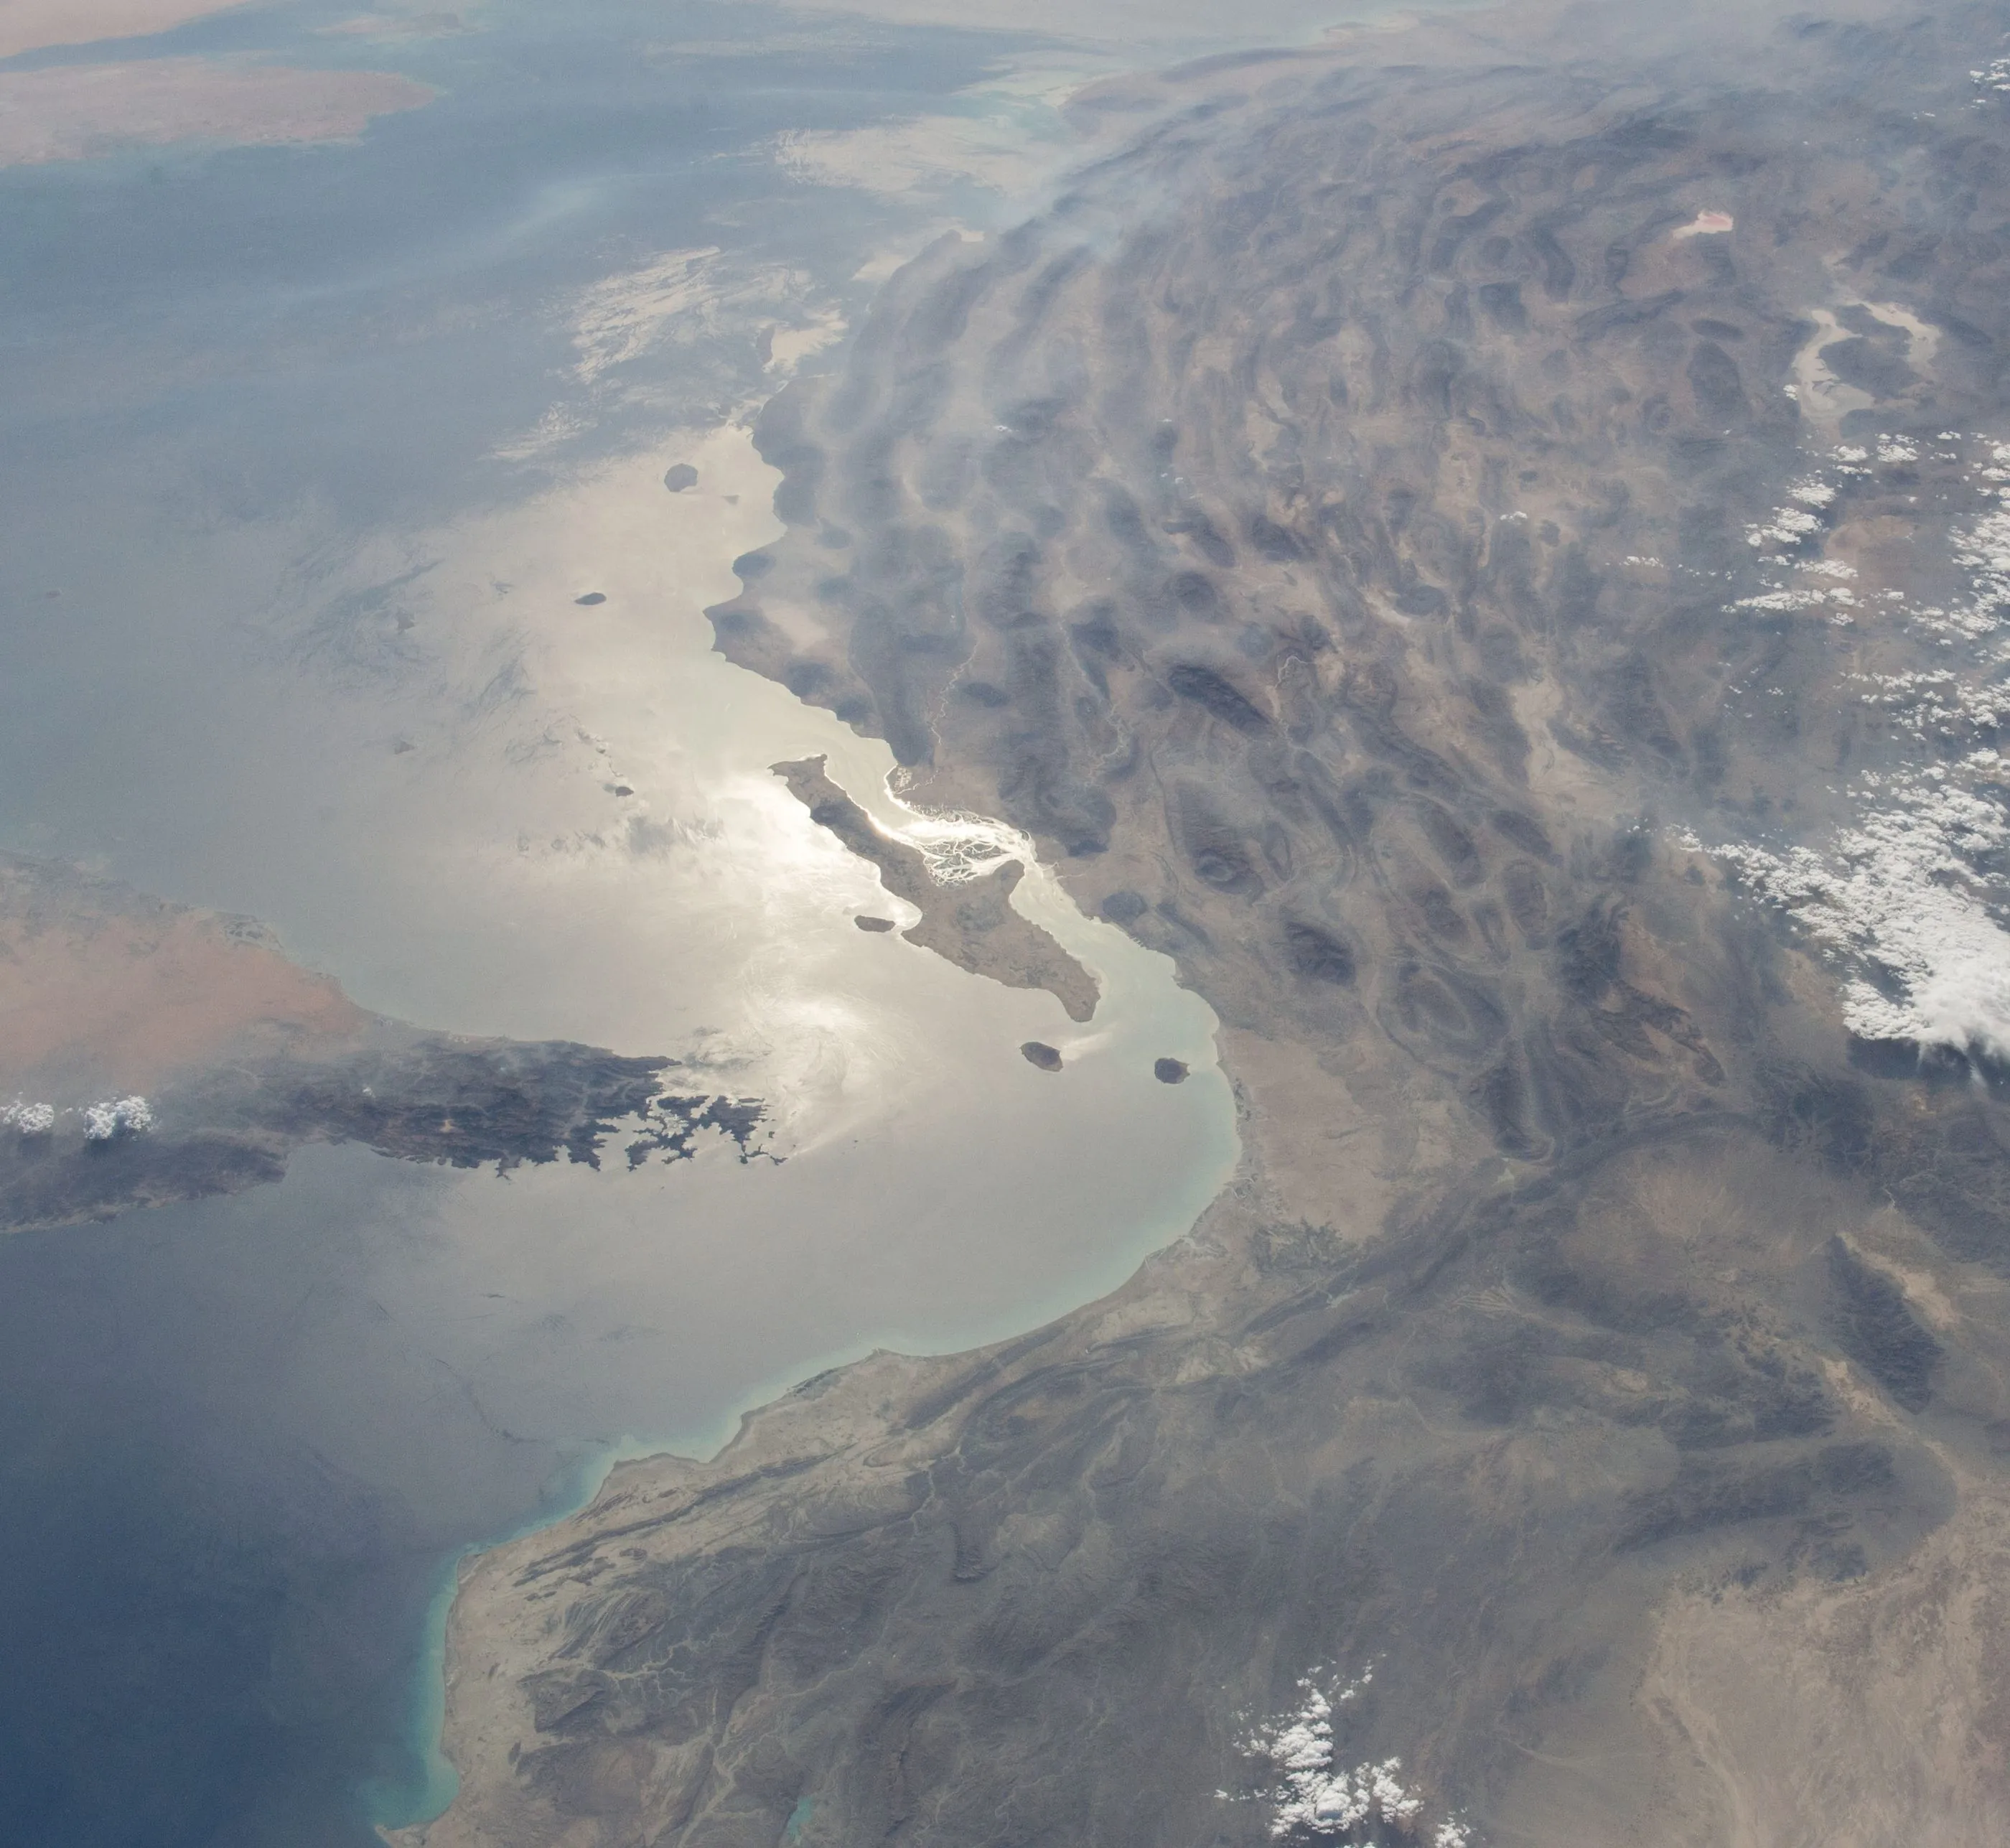
The Strait of Hormuz and the Musandam Peninsula from the International Space Station, June 2016. NASA Johnson Space Center, Public domain.
The Energy Information Administration released its weekly report on 21 October for the week ending 16 October. It shows the cushion expected to replace Persian Gulf crude is tightening from two sides at once: domestic inventories fell to a four-decade low, and seaborne exports dropped by almost a quarter in seven days.
What happened
US commercial crude inventories 412.5 million barrels (draw of 3.06 mb) . EIA Weekly Petroleum Status Report Commercial crude inventories fell by 3.06 million barrels to 412.5 million barrels. That draw was larger than the roughly 1 million barrels analysts expected. Gasoline inventories fell by 2.95 million barrels to 205.3 million. Distillates built by 1.68 million barrels to 104.3 million. Refinery runs were steady at 93.4% of operable capacity.
Total US crude inventories (commercial plus SPR) 695.2 million barrels, lowest since October 1983 . EIA Weekly Petroleum Status Report Strategic Petroleum Reserve (SPR) inventory 282.7 million barrels (draw of 0.3 mb) . EIA Weekly Petroleum Status Report The Strategic Petroleum Reserve declined by another 300,000 barrels to 282.7 million barrels. Combined, total US crude inventories—commercial tanks plus the federal reserve—dropped to 695.2 million barrels. By EIA records, that is the lowest aggregate volume since October 1983.
US crude oil exports 3.44 mb/d (down 1.128 mb/d on previous week) . EIA Weekly Petroleum Status Report At the same time, crude leaving US docks shrank. US crude exports averaged 3.44 million barrels a day, down 1.128 million barrels a day from the prior week’s pace. Because crude imports fell more modestly—down 291,000 barrels a day to 5.76 million—net crude imports rose by 837,000 barrels a day to 2.32 million.
What the sources say
The EIA data documents the physical balance. Market reporting links the export slowdown to shipping logistics. Supertanker chartering costs from the US Gulf to Asia reached unprecedented levels in mid-October. Reuters reported on 15 October that a late-November fixture for a 2-million-barrel supertanker from the US to Japan (Esteem Explorer) was priced at $81 million lump-sum, or roughly $40.50 a barrel in freight alone. A year earlier, that route averaged $9.1 million.
With freight eating more than a third of the value of a barrel of crude, the transatlantic and transpacific arbitrage has tightened sharply. Asian refiners have delayed US Gulf liftings or sought delivered barrels, while Persian Gulf shuttle transfers absorb available tonnage.
Valtor’s inference Our reading, which is an inference: markets have priced Brent near $110 on the assumption that Atlantic-basin production, led by the US, will bridge whatever volumes the Strait of Hormuz cannot move. The EIA figures contradict that assumption on two counts. First, the total domestic crude buffer has broken below 700 million barrels for the first time in 43 years. Second, US barrels cannot clear easily when tanker freight acts as a $40 surcharge. The US cannot act as a shock absorber without either draining already historic lows in domestic stocks or seeing tanker rates break.
What to watch
- The next EIA export print on 28 October: whether crude outflows remain pinned near 3.5 mb/d or rebound.
- US Gulf VLCC spot fixtures: whether charter rates to East Asia stay near the $40/bbl threshold or ease back toward historical norms.
- The WTI-Brent spread: whether US crude needs to widen its discount to Brent to compensate for elevated freight.
Figures in this piece
Each also stands in the margin beside the paragraph that states it.
- 695.2 million barrels, lowest since October 1983Total US crude inventories (commercial plus SPR). EIA Weekly Petroleum Status Report
- 3.44 mb/d (down 1.128 mb/d on previous week)US crude oil exports. EIA Weekly Petroleum Status Report
- 412.5 million barrels (draw of 3.06 mb)US commercial crude inventories. EIA Weekly Petroleum Status Report
- 282.7 million barrels (draw of 0.3 mb)Strategic Petroleum Reserve (SPR) inventory. EIA Weekly Petroleum Status Report
Sources
Filed under Iran war.
A number here looks wrong? Send a correction. How corrections are handled.
Get it by email
New analysis and notes, at most once a week. The address is used for nothing else, and one reply takes you off the list. Privacy notice.